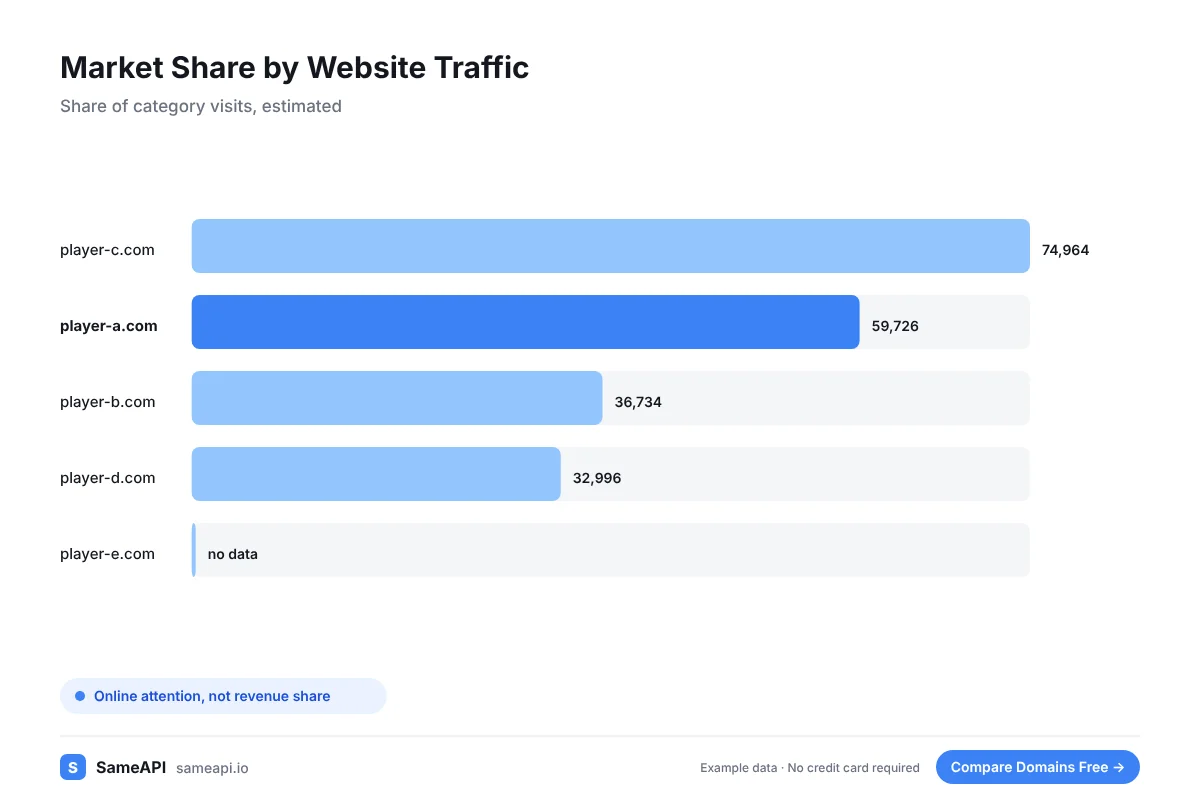
Market Share by Website Traffic
Market share by website traffic shows how online attention splits across the players in a category. SameAPI estimates visits for every company in your list so you can see each one's share.
Build a share-of-traffic view for any market in minutes, without buying a research report.
No credit card required.
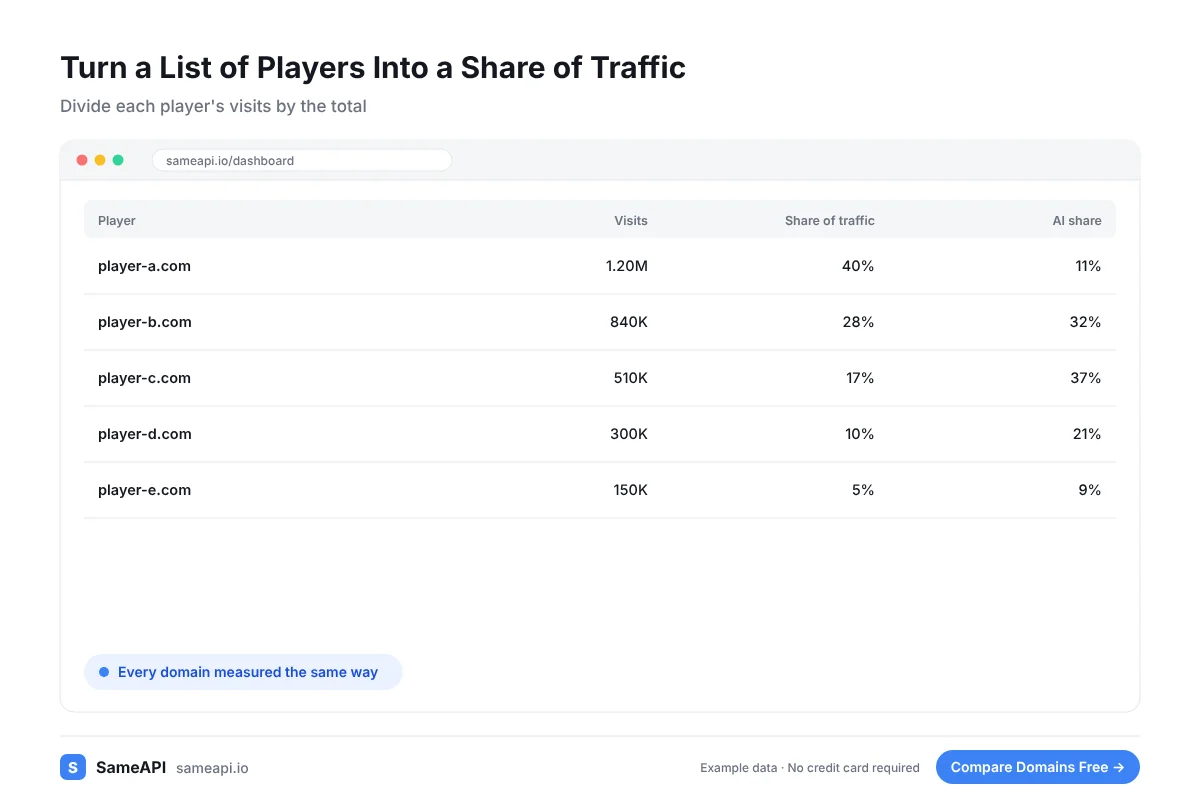
Turn a List of Players Into a Share of Traffic
Paste the domains of every company in a category. Add up their estimated visits and each company's share falls out.
- Estimated monthly visits for the last three months
- Category and category rank for each player
- Top countries by share of visits
- Search, direct, social, referral, paid and email share
- AI referrals from each assistant that sends traffic
Export to a spreadsheet and divide each company's visits by the total. That is your share-of-traffic chart.
Add the AI columns to see which players AI assistants favor. That share can differ a lot from the overall one.
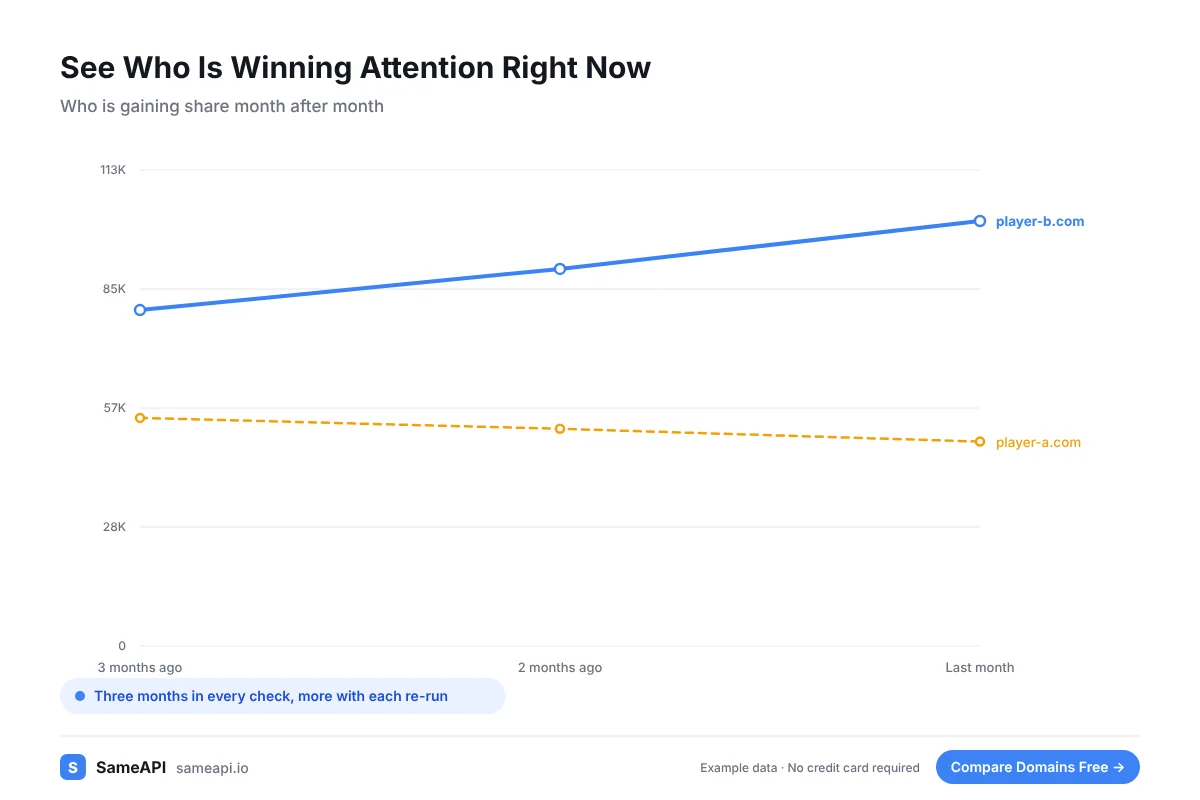
See Who Is Winning Attention Right Now
Annual market reports arrive late and cost a lot. Web traffic updates every month.
Compare the three monthly figures for each player. A company gaining share month after month is taking attention from the rest.
Split the view by country to see who leads in each market. A global leader can be a small player in one region.
Look at the source mix too. A player that wins on paid traffic holds its share only as long as the budget lasts.
Know What Share of Traffic Means and What It Does Not
Share of web traffic is a measure of online attention. It is not revenue market share.
Companies that sell mostly offline, through apps or through partners can be larger than their web traffic suggests. Treat the numbers as one input next to your other sources.
For many online businesses, attention and sales move together. The traffic view is often the fastest proxy you can get.
It is cheap to refresh. You can update the chart every month instead of once a year.
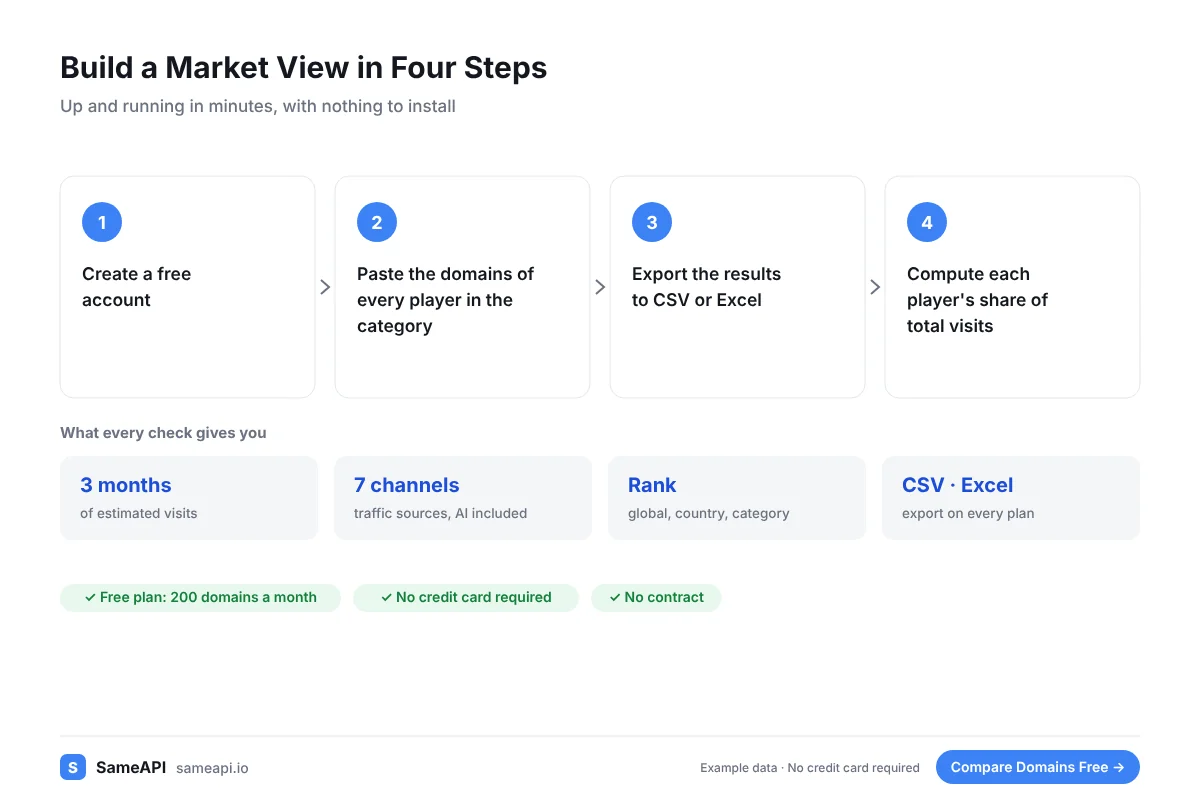
Build a Market View in Four Steps
You can do it in the dashboard and a spreadsheet. No data team is needed.
- Create a free account
- Paste the domains of every player in the category
- Export the results to CSV or Excel
- Compute each player's share of total visits
Keep the list and repeat each month. Your exports show how share moves over time.
A simple line chart of share by month is often the clearest slide in a strategy deck.
Built for Strategy and Research Teams
- Strategy consultants sizing markets for clients
- Corporate strategy teams tracking their category
- Investors comparing players in a sector
- Founders preparing a market slide for a pitch
- Agencies building category reports
The free plan covers 200 domains a month, enough for most categories. Paid plans start at $20 a month with no contract.
Map Your Market by Traffic Today
Paste the players in your category and see who holds the attention.
No credit card required.
Last updated: